Where stored grain beetles come from (GRDC Ground Cover May 2017)

Stored Grain Sieving insects

Source Link GRDC

Key points

  • Grain is most likely to be infested by beetles from your storage facility
  • Effective hygiene can delay infestation for at least two months
  • Beetles typically fly within a two-kilometre radius to infest another grain storage
  • Some beetles can fly more than 100km to infest grain
  • Flying beetles are spreading insecticide resistance over large areas

Photo of a mini silo fitted with 50 litres of wheat set up near existing farm storage

A mini silo filled with 50 litres of wheat set up near existing farm storage.

PHOTO: Dr Andrew Ridley

Infestation of stored grain can sometimes seem inevitable, but storage pests are reliant on a food source that we control. Too often we provide a friendly environment for these pests by failing to detect and deal promptly with infested grain, or clean out empty silos and equipment.

If we are ever going to reduce our reliance on killing pests once they have infested grain, we need to better understand the insects and how they infest our grain storage in the first place.

The results from research conducted on Australian grain farms by the Queensland Department of Agriculture and Fisheries and the University of Queensland offer some helpful instructions for grain storage best practice.

Harvested grain placed into a silo can become infested from two potential sources. First, there may be a residual pest population hiding in grain handling machinery or silos that will be incorporated into freshly harvested grain. Second, pests can move into the grain of their own accord by flying in from infested silos.

A common misconception is that pests are brought in with the crop at harvest time and this is when infestation starts. It is true that insects such as grasshoppers and lady beetles are harvested along with grain, but these field crop pests die quickly in the dry conditions of stored grain.

The majority of stored grain beetles do not infest standing crops, so this is not likely to be the source of the problem. Only if you are harvesting legumes or maize should you be concerned about gathering up unwanted storage pests with your grain.

When harvesting legumes or maize, keep an eye out for adult beetle exit holes (these are hard to miss) or small white eggs glued to the surface of the seeds in grain samples. Also, use an insect sieve for maize and legumes as you are filling silos during harvest. Get pests identified correctly to see if they are field pests or storage pests. When storage pests are detected during harvest, aerate grain initially over the first two weeks to provide safe uniform grain storage conditions, then seal the silo to fumigate pests. Once pests are killed, return to aeration.

Residual pest populations

Photo of Dr Philip Burril

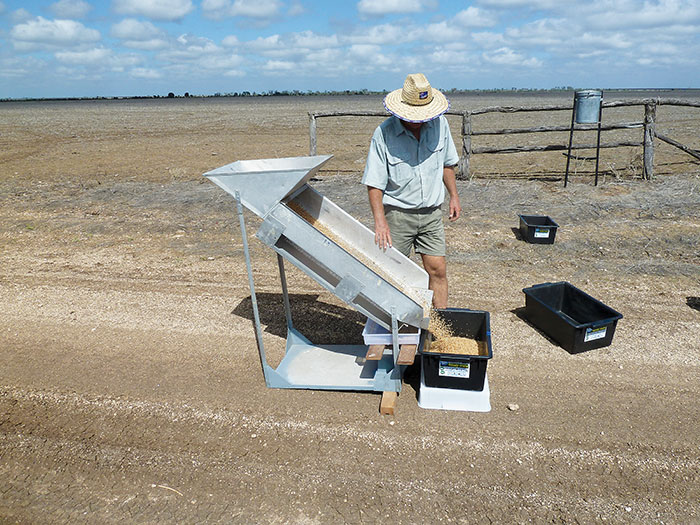
Dr Philip Burrill of Queensland DAF sieving grain from a mini silo placed 2km from farm storage in Mount McLaren.

PHOTO: Dr Andrew Ridley

Most grain storage beetles are long-lived and can survive on very small amounts of food. Grubs of the red flour beetle (Tribolium castaneum) can survive on the thin layers of grain dust that settles on flat surfaces.

It can be difficult, therefore, to eradicate pests from machinery and storages unless these structures are specifically designed to assist in cleaning. Some silos are made with flat internal surfaces so grain and dust have nothing to cling to. Flat bottom silos with ‘full floor’ aeration are, in contrast, not easy to clean. Removing grain residues in the subfloor area is difficult. Some manufacturers provide a flat bottom silo with channel aeration systems that are simple to clean and just as effective for aeration cooling.

When purchasing new grain storage, take hygiene into account. The silo will be there for a long time and the easier it is to clean the more likely you are to do it.

Grain-handling machinery that contains small amounts of grain can be a source of pests. One header we sampled was hiding more than 1000 lesser grain borers (Rhyzopertha dominica) waiting to be mixed with freshly harvested grain.

Headers, augers, grain dryers and other grain-handling equipment can be cleaned with compressed air and then dusted with a diatomaceous earth product such as Dryacide® to kill any remaining pests.

Likely sources of pests

If you have an existing infestation somewhere at your grain storage facility, your freshly harvested grain will most likely become infested with beetles quickly.

Photo of a beetle trap

One of the beetle traps set one kilometre from grain storage that caught storage pests flying from one farm to another.

PHOTO: Dr Andrew Ridley

We placed wheat in mini silos (50-litre capacity) near farm silos in central Queensland and sieved the grain after two months. We also looked for pests in the storages on each farm. We found that where a farm already had a particular pest species in storage facilities, it usually infested the clean grain in our nearby mini silos quickly.

We also found that the mini silos were unlikely to become infested by pest species that were not already present on the farm. This demonstrated that hygiene, when done well, can delay the onset of infestation by at least two months. For grains harvested in spring, delaying infestation beyond summer can greatly reduce the need to control pests once temperatures drop in winter and pests are less likely to be flying.

Disposal of old and waste grain that tends to be heavily infested will make the greatest impact on the number of pests in your storage facility.

Even small parcels of grain can produce huge numbers of pests. When 100 beetles each of six pest species were introduced into a 27-kilogram box of wheat, more than 1.5 million beetles were produced over the course of a year. Most of these beetles were caught leaving the infestation.

But how far away do you need to dump waste and infested grain? If possible it is always best to bury, burn or spread (less than 10 millimetres deep) infested waste grain.

Grain in mini silos, which were placed two kilometres away from a storage facility was much less likely to be colonised by flying beetles. Therefore, if possible, separate infested grain from grain you wish to sell insect-free by at least two kilometres. This will significantly decrease the risk of infestation from flying storage pests.

Mixed farming operations have particular challenges in terms of insect-free grain storage. Feed mills are difficult to keep pest free because the continuous flow of grain makes sealing silos for fumigation difficult.

The labour involved in cleaning hoppers and augers leads to exposed parcels of grain highly likely to contain storage pests. If I go to a farm looking for storage pests and see a feed mill, the hopper is the first place I look. Storage piles of cotton seed are also a favoured site for the red flour beetle, a common pest of grain in storage.

Mean number of lesser grain borer beetles caught in 15 traps baited with R. dominica pheromone lures

Figure 1 Mean (± standard error) number of lesser grain borer (Rhyzopertha dominica) beetles caught in 15 traps baited with R. dominica pheromone lures located at farm storages (red) and in paddocks at least one kilometre from those storages (orange). Traps were active for seven days at each sampling period.

If feed mills and stored commercial grain are co-located, grain protectants can be used on feed grain to reduce the chance of these grains becoming breeding grounds for storage pests. Always check the chemical label and discuss chemical application with potential buyers prior to applying any grain protectant treatments.

It is easy to wonder how you ended up with infested grain despite doing a thorough job of hygiene. Unfortunately, just as pests are moving from silo to silo within a complex, they are also moving between properties. We showed this in southern Queensland, where we set up traps for flying beetles in paddocks at least 1km from farm storage, typically along fencelines. We caught lesser grain borers and red flour beetles throughout the year (Figure 1).

So what you and your neighbours do to manage stored grain pests will have an impact on everyone.

Resistance moves with beetles

The ability to manage grain storage pests with grain protectant insecticides and the fumigant phosphine is extremely valuable to the Australian industry. Nil tolerance for live pests is the standard for receival, so tools to deal with storage pests are crucial.

One of the big downsides of beetles moving from one grain storage to another is the potential spread of resistance to control tools. Long-term storage of grain that relies on multiple applications of phosphine or over-reliance on one type of grain protectant – or ineffective fumigation due to silos not being sealed correctly – will result in selection for resistant populations that are harder to kill. These difficult-to-control pests then fly off and infest other parcels of grain.

We can measure the relationships of beetles from different farms using genetics. What we found, after sampling farms in the Southern Downs district of Queensland, is that there has been enough movement to make all beetles from an area of more than 4000 square kilometres become part of ‘one big family’.

This means when one person does the wrong thing and allows selection for resistance, these harder-to-kill beetles are moving to other farms. Using this population genetics technique we estimate that some beetles have travelled more than 100km.

The movement of resistance genes is particularly important when we consider the rusty grain beetle (Cryptolestes ferrugineus). This beetle has become very difficult to kill with phosphine compared with other pests.

Stored grain beetles are hard to control, but with access to treatments and quality storage, Australian growers are some of the best at delivering high-quality grain. Better planning to limit the pressure of insect infestation on your grain will help protect our current treatments and maintain Australia’s good reputation.

More information:

Dr Greg Daglish,
07 3708 8538,
greg.daglish@daf.qld.gov.au

Philip Burrill,
0427 696 500,
philip.burrill@daf.qld.gov.au

GRDC Project Code Plant Biosecurity Cooperative Research Centre Codes CRC50089, CRC50149, CRC3039

Region National

Venting after fumigation (DAF QLD)

Stored Grain Venting paper

Philip Burrill, Greg Daglish, Manoj Nayak DAF Qld.

PBCRC code: PBCRC 3150

Take home messages
• Venting grain after phosphine fumigation may take longer than the current label minimum recommended times. e.g. 1 day fan venting
• Applying the workplace phosphine safety limit of TWA 0.3 ppm, using the current testing method of ‘spearing grain in truck’ at delivery point, may need industry assessment
• During fumigation, grain absorbs small amounts of phosphine. It takes a number of days for the grain to desorb this gas to very low levels
• Augering grain into a truck immediately after fumigation, with no venting, only briefly removes phosphine gas from the intergrain spaces. Grain rapidly desorbs more phosphine gas
• Research presented in this paper is from only one trial (Feb. 2017) on wheat. There is very little field research data on venting phosphine fumigations. More research is required

Venting after phosphine fumigations – is there a problem?
In 2016 more than 70 truckloads of grain were rejected at the Port of Brisbane. They exceeded the 0.3 ppm phosphine gas concentration limit at delivery when grain was speared in the truck on the weighbridge.
The majority of the trucks rejected had phosphine gas concentrations in the range of 0.5 to 2.5 ppm. However a few had very high concentrations of 32, 82 and 440 ppm.
Grain load rejections for phosphine detections are also occurring at the Port of Melbourne and other grain receival sites, plus at a range of domestic grain buyers, such as stockfeed manufacturers, throughout Australia.
These grain rejections at the point of delivery are not only costly to individual grain growers and grain handlers, but this adds additional costs to Australia’s grain logistics and export supply chain.
In the interests of employee safety at grain receival sites, businesses are apply the Workplace Safety standards for phosphine (PH3) using the TLV – TWA of 0.3 ppm.
The current method of testing when applying the TWA 0.3 ppm standard is to spear the grain in the truck on arrival and test gas concentrations within the grain before unloading.

Phosphine label – ventilation, what does it say?
Ventilation of structures is complete only when the phosphine concentration measured at appropriate locations in the enclosure and work area are below TLV – TWA exposure standard 0.3 ppm.
Following are minimum vent periods and may need to be increased to ensure standards (0.3 ppm)is not exceed:
Structures, including bunker storages:
• Not less than 1 day: with throughflow and forced draught (flash-proof fan)
• 2 – 5 days: with throughflow and natural draught (wind). Structures 300 tonnes or greater,
2 – 5 days depending on size. Structures less than 300 tonnes capacity, 2 days
• Not less than 5 days: without throughflow ( i.e. access only through the headspace)

Applying the TWA workplace safety standard:
The grains industry in conjunction with the appropriate National & State, Work place health & safety authorities should clarify the interpretation and practical application of the TLV – TWA 0.3 ppm standard. In particular the wording – “phosphine concentrations measured at appropriate locations in the enclosure and work area”.
Is the current practice of measuring phosphine gas concentrations ‘within the grain bulk’ in the truck prior to unloading, an “appropriate location and work area” when apply the 0.3 ppm TWA worker safety standard?
A definition of TWA: “The TWA exposure value is the average airborne concentration of a particular substance when calculated over a normal 8 hour working day for a 5 day working week.”
So a worker is not to have an average phosphine exposure of greater than 0.3 ppm for 8 hours per day, for 5 days per week (40 hour week).

Stamp out poor, illegal practices
For the sake of Australia’s grains industry reputation, safety and using phosphine the way it should be used to control pests, the following practices by a small minority must be stopped:
1. Growers & commercial grain facilities – “not venting” after fumigations, augering straight into trucks for delivery
2. “Short”, last minute fumigations in the back of trucks before delivery. Not following label fumigation or venting times
3. Placing phosphine tablets directly into the grain, so tablet dust remains in grain
4. Truck drivers adding phosphine tablets to loads at some point during the delivery

Ventilation research – wheat 2017
In February 2017, phosphine fumigations on wheat were conducted in two small research silos (35 tonnes capacity) at the Hermitage research facility Warwick by Department of Primary Industry & Fisheries Qld Postharvest researchers.
Following standard phosphine fumigations (1.5 g / m³) for 7 days in “Silo A” and 10 days in “Silo B”, top lids where opened and aeration fans turned on for post fumigation ventilation for 1 day (24 hours).
The phosphine gas concentrations in Silo A are shown in Fig. 1 after a 7 day fumigation and 1 day (24 hours) ventilation period, with 20 hours of fan run time.
Phosphine gas concentrations in Silo A prior to ventilation commencing was 980 ppm approximately in all areas within the silo.
The yellow arrow indicates where the 1 day ventilation period has finished and gas measurements in grain have started. Gas sample tubes placed in the silo provided measurements points in grain at three locations, top, middle and bottom. The first gas readings were taken one hour after the ventilation fan was turned off.
The blue arrow indicates the point where the 35 tonnes of wheat was augered out of the silo and into a truck, then within one hour augered back into the silos. After one hour, gas readings were once again measured in grain.


Fig. 1 Phosphine gas conc. in wheat after 1 day fan ventilation, followed by two auger tranfers

Research findings – Silo A
• Within 1 to 2 hours after a 1 day fan ventilation, wheat kernals “desorbed” phosphine back into the intergrain spaces bringing gas concentrations from zero back up to 0.4 – 0.6 ppm.
• 24 hours after ventilation was completed phosphine gas concentrations within the grain bulk had risen to 0.8 – 2.0 ppm
• One day after venting wheat, it was augered into a truck and then augered back into the silo. Gas reading 20 hours after twice augering went from zero to 0.2 – 1.2 ppm
• Wheat kernals are still desorbing phosphine over a number of days beyond a 1 day fan ventilation, bring concentations well over 0.3 ppm

Phosphine gas in the grain bulk compared to surface
With the aim of having an initial look at the safety risk of working around grain that has been fumigated and vented for 1 day (24 hours fan run time), grain at the top of “Silo B” (10 day fumigation) was tested for phosphine gas concentrations in the grain bulk and at the grain surface.
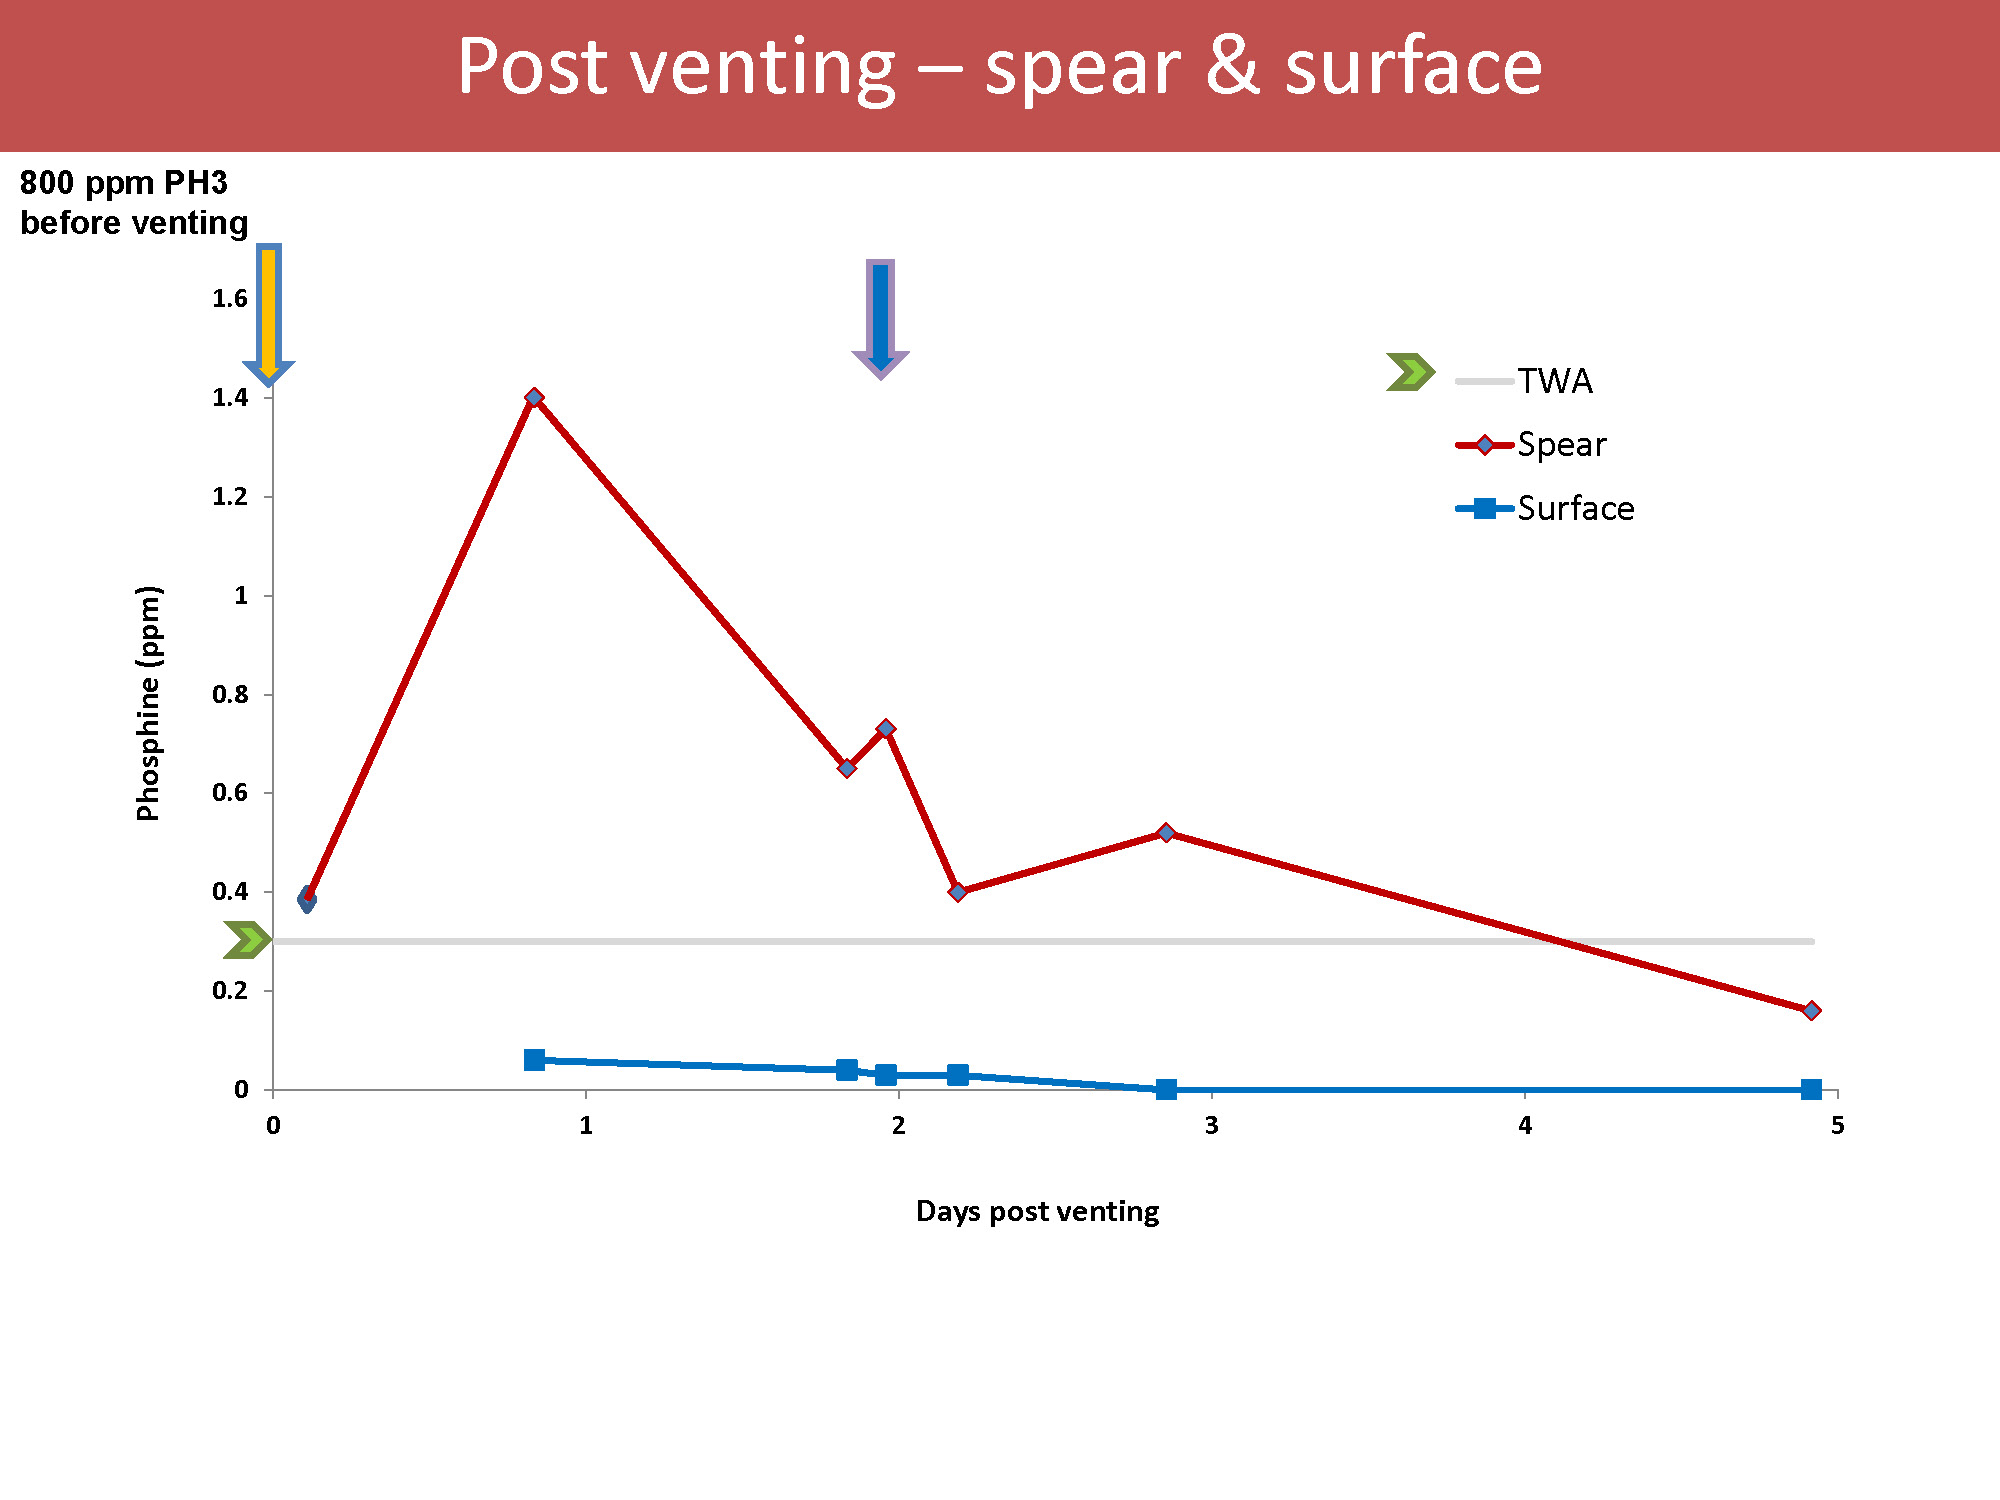
Using a 1 meter ‘spear’, gas readings where taken at a depth of 1 meter in the grain at the top of the silo and at the same time, gas reading on the grain surface were recorded. See Fig. 2.


Fig. 2 Phosphine gas conc. in wheat after 1 days ventilation, at 1m depth and on the grain surface

Research findings – Silo B
• After 20 hour post venting (24 hours fan run) phosphine gas conc. in grain at a depth of 1 m in the top of the silo went from zero back up to 1.4 ppm. Similar to gas levels in Silo A.
• However, at the same time gas readings of 1.4 ppm are measured in the grain bulk, the gas concentrations on the surface of the grain were much lower – 0.06 ppm
• Phosphine gas concentrations on the grain surface after 1 day venting are well below TWA 0.3 ppm

Research summary
1. More research is required on wheat and other grains to draw reliable conclusions as there is very little field research data available on phosphine gas concentrations after venting
2. Wheat can desorb phosphine gas for a number of days beyond a 1 day fan ventilation
3. We require field research and clarification of what is the appropriate industry ‘testing method’ that is best suited to access compliance to the TWA 0.3 ppm phosphine safety standard

Further reading
• GRDG Factsheet – “Grain Fumigation – a guide” https://storedgrain.com.au/fumigation-guide/
• GRDC booklet – “Fumigating with phosphine, other fumigants and controlled atmospheres” https://storedgrain.com.au/fumigating-with-phosphine-and-ca/
Acknowledgements
The research undertaken is made possible by the significant contributions of DAF Qld’s Postharvest research team, Hermitage research station staff, agribusiness and growers. The author would also like to thank the PBCRC, GRDC, and GRDC’s national grain storage extension team, for their continued support.

Contact details
Philip Burrill
Department of Agriculture & Fisheries, AgriScience Qld.
Hermitage research facility, 604 Yangan road, Warwick Qld. 4370
Ph: m. 0427 696 500
Email: philip.burrill@daf.qld.gov.au

Investment in on farm storage and the grain supply chain

Source Link GRDC
Author: Andrew Freeth, ‘Fairfield’ Gilgandra, Nuffield Farming Scholar

Take home message

Growers considering investment in On Farm Storage (OFS) should establish clear objectives, consider future needs and plan with potential expansion in mind. Long term, the growth trajectory of OFS investment will be driven by the service offering from the commercial bulk handlers and also by the growth in domestic grain production and consumer needs. Managing relationships with supply chain partners is critical if growers are to effectively take on a greater role in the supply chain.

On-farm storage and the grain supply chain

It is likely that Australian growers will continue to increase overall On Farm Storage (OFS) capacity and improve the quality and sophistication of existing infrastructure. This trend is currently being driven by:

  • harvest logistics and increased harvester capacities;
  • rationalisation of the upcountry grain storage network;
  • the increased area sown to pulse and specialty crops;
  • government incentives to invest;
  • increases in overall grain production and
  • greater willingness of growers to have greater control of their grain path to market stemming from strong recent returns from selling grain ex-farm relative to the Bulk-Handler system.

Australia’s lack of an effective freight ‘System’ feeding main line rail in Eastern Australia is a constraint on productivity for the grains industry. Australian East-coast below rail assets do not currently meet the needs of a modern grain supply chain. State and Federal Governments have a challenge to ensure policy settings exist, including alternative funding sources to facilitate and fast track investment. The long term future of grain logistics in Eastern Australia will be heavily influenced by the construction of a Melbourne–Brisbane inland rail freight link. Sub section construction timelines will be an important component of this project. Governments also need to consider market led road upgrades that safely enable longer road combinations and enhanced productivity on strategically important grain road routes.

The grains industry relies on fumigation with Phosphine gas to kill stored grain pests with few commercial alternatives available. The future management of grain in store will need to consider alternatives for maintaining grain in a saleable condition. The industry needs to maintain focus on fumigating in gas tight storage that meets Australian standard AS2628 to maximise the longevity of phosphine as a fumigant. The best alternative strategy to fumigation is to:

  • limit the incursion of stored grain pests and by using good hygiene practices;
  • adequate monitoring and cooling grain using automated aeration systems, and
  • the use of grain protectants, subject to market requirements.

Acknowledgements

The author would like to thank the GRDC for supporting the research undertaken.

Contact details

Andrew Freeth
Nuffield Farming Scholar
‘Fairfield’, Gilgandra, NSW, 2827.
Ph: 0407 205 503
Email: adfreeth@gmail.com

Finding storage pests early

Source Link GRDC
Author: Greg Daglish, Queensland Department of Agriculture and Fisheries

Take home message

  • A pilot study in southern Queensland demonstrated that combining the use of probe traps in the top of a silo with sieving a grain sample from the bottom was an effective insect detection method.
  • Probe traps inserted into the grain surface tended to catch more beetles than traps inserted deeper.
  • Probe traps inserted into the grain peak via the silo centre top hatch tended to catch more beetles than traps inserted via the roof side hatch.
  • Check traps after 1 day initially to avoid clogging if there is a heavy infestation, and less frequently thereafter (e.g. monthly) if few or no beetles are detected.
  • Further research is needed examining the relative effectiveness of sieving and trapping for detecting different species, and how serious the situation is when beetles are first detected.

Background

Options for farmers to detect insects in stored grain were explored in a pilot study in 2016 on two farms in southern Queensland. Increasing on-farm storage comes with an increasing risk of insect infestation. There is an urgent need for appropriate sampling methods to help farmers manage this risk and minimize marketing delays. Simple, safe, cost effective and easy to interpret sampling options will enable growers to make informed decisions about pest management.

Silos containing wheat or barley were sampled for stored grain beetles using two methods (Figure 1):

  • Sieving of grain samples taken from the top and bottom of the silo
  • Captured in probe traps inserted into the grain via the side and top hatches

The bottom grain (2 L) sample was collected by dropping grain from the bottom of the silo. The top grain sample (4 L) was a composite of two samples scooped from the grain surface, i.e. one sample (2 L) scooped from the top hatch and a second sample (2 L) scooped from the side hatch.

Probe traps were inserted into the grain via the top and side hatches. In each case, one trap was inserted to trap beetles 0-28 cm from the grain surface (shallow trap) and the second trap was inserted so that it trapped beetles 28-56 cm from the grain surface (deep trap).

Research results

In this pilot study, stored grain beetles were detected in grain samples and probe traps.

In silos in which beetles were detected in sieved grain samples, the bottom and top grain samples yielded on average 78 and 20% of the beetles respectively (Figure 2). This was despite the top sample having twice as much grain as the bottom sample.

In silos in which beetles were detected in the probe traps, the shallow and deep traps captured on average 82 and 18% of the beetles respectively (Figure 3).

In silos in which beetles were detected in the probe traps, the traps inserted via the side and top hatches captured on average 24 and 76% of the beetles respectively (Figure 4).

It is possible that the usefulness of sampling and trapping may vary between pest species, but it is not possible to confirm this at this stage.

In several heavily infested silos some probe traps captured many thousands of Tribolium castaneum (red flour beetle) beetles resulting in traps becoming congested.

Automatic loggers were used to monitor temperature and humidity in some silos (e.g. Figures 5 and 6).  Temperature and humidity varied widely in the headspace reaching potentially lethal levels in the middle of the day. In contrast, temperature and humidity was much more stable in the grain bulk.  Beetles are likely to avoid the grain surface during this time of extreme high temperature and low humidity, potentially impacting on the usefulness of visual inspection for beetles on the grain surface.

Preliminary recommendations

There are many beetle species that can infest stored grain and at least five pest species were detected in this study. From a scientific perspective, knowing the identity and exact numbers of beetles in grain samples or probe traps is valuable. From a grower perspective, however, the presence of any beetles in stored grain is a problem.

This pilot study focussed on two simple methods that could be used by growers to detect pests in stored grain, and the following recommendations are based on the results.

  • Sieving of grain samples and using probe traps in the top of the grain bulk is useful.
  • If sieving grain is to be limited to one location, then a sample from the bottom of the silo is preferable to one from the top of the silo.
  • Probe traps should be inserted into the grain bulk so that the top of the trap is level with the grain surface.
  • If trapping is to be limited to one location then inserting the probe trap into the grain through the top hatch is preferable to inserting it through the upper side hatch.
  • Initially, probe traps should be inspected after 1 day in case there is a heavy infestation, with the risk of large numbers of beetles clogging the traps. If no or few beetles are trapped in the first instance longer trapping period can be used.
  • Extremely high temperature and low humidity is possible during the middle of the day, so early morning may be the best time for visual inspection of the grain surface for beetles.

Unanswered questions

  • Are the results of this pilot study applicable more broadly?
  • What does it mean if I get one beetle or many beetles in my sieved sample or my probe trap? And is the answer the same soon after harvest or later during storage?
  • Do different pest species tend to be in different parts of the grain bulk, and how does this affect detection through sampling or trapping?

Acknowledgements

This pilot study was made possible through an Agri-Science Queensland Innovation Opportunity award from DAF entitled ‘Sampling options for farmers to detect insects in stored grain’. I am very grateful to two grain growers and their families for allowing me access to their properties and my DAF colleagues Philip Burrill and Valerie Byrne.

Contact details

Greg Daglish
Queensland Department of Agriculture and Fisheries
EcoSciences Precinct, Dutton Park
Ph: 07 3255 4438
Email: greg.daglish@daf.qld.gov.au

Grain sieve and probe trap

Figure 1. Grain sieve and probe trap used for detecting insect pests in farm silos.

Candlestick chart showing level of grain beetles detected in grain samples

Figure 2. When grain beetles were detected in grain samples then more beetles tended to be detected in the bottom sample than the top sample.

Candlestick chart showing beetles detected in grain samples.

Figure 3. When beetles were detected in probe traps then traps inserted near the grain surface tended to catch more beetles than traps inserted deeper.

Candlestick chart showing beetles detected in grain samples

Figure 4. When beetles were detected in probe traps then traps inserted via the top hatch tended to catch more beetles than traps inserted via the side hatch.

A scatter chart showing temperature measured half-hourly in the headspace and grain bulk in a silo containing barley.

Figure 5. Temperature measured half-hourly in the headspace and grain bulk in a silo containing barley.

A scatter chart showing relative humidity measured half-hourly in the headspace and grain bulk in a silo containing barley.

Figure 6. Relative humidity measured half-hourly in the headspace and grain bulk in a silo containing barley.

Killing storage pests without mercy

Source link GRDC

Author: Andrew Ridley, Philip Burrill and Pat Collins, Queensland Department of Agriculture and Fisheries

Take home message

Results of trial fumigations conducted in 1,400 t silos to test the capability of these large storages have led the following conclusions:

  • Recirculation greatly facilitates the distribution of gas in large silos
  • Fumigation in large silos without recirculation results in much lower concentration in the base of the silo.
  • Peak concentration of phosphine typically occur between day 4 and 6 and decline for the rest of the fumigation.
  • The current pressure half-life standard (AS2628) of 5 minutes is appropriate for large silos and is vital for effective fumigation.
  • Fumigations are likely to fail where there are points of gas / fresh air leaks in a silo. Pressure testing prior to fumigation is a vital step in identifying and locating gas leaks.
  • Strongly phosphine resistant rusty grain beetle can only be controlled by extending fumigation time beyond the minimum label recommendation (of 20 d for blankets) or by implementing active recirculation.

Introduction

There are very few options available to growers to control storage pests when an infestation has been detected. Phosphine, sold in solid formulation of aluminium phosphide (AlP) under the trade names such as phostoxin® or fumitoxin® is by far the most common disinfestation treatment for stored grain.

The label was first written in the 1970’s for relatively small silos and other storages. A significant number of growers are now investing in large capacity (e.g. 1,500 t), flat bottom silos for storing grain on farm. We do not know whether the label directions are appropriate for these larger storages.

Coupled with this uncertainty is the development of strong phosphine resistance in the rusty grain beetle. The resistant populations of the rusty grain beetle, found at a number of sites in eastern Australia, are significantly harder to control than other pests and label rates may need to be updated.

Fan forced recirculation of gas in large silos helps to distribute phosphine and has been advised for some time. Recirculation is not a requirement on the current label but may be a cost effective way to perform better fumigations.

The aim of this trial was to answer the following questions:

  • Can strongly resistant rusty grain beetle be controlled in large farm silos?
  • Is the current Australian Standard (AS2628 – 5 min pressure half-life) for silo gas-tightness appropriate for large silos?
  • What concentrations of phosphine are achieved under passive gas distribution and to what extent does that lengthen the fumigation?
  • Do large silos need recirculation for effective fumigation?
  • What is an acceptable recirculation air flow rate and system design for large silos?

Two silos, labelled A and B, were fumigated at label rates. The phosphine in silo A was dispersed by natural means (passive fumigation). The gas in silo B was recirculated (active fumigation) for the first five days of the fumigation. Phosphine concentrations were monitored at four centre sampling points (headspace and at 9, 5, and 1 m above the floor) and at three points around the base wall (North, 120° and 240°) of each silo. Silo A had a Pressure Half Life (PHL) of 7 minutes and 35 seconds and silo B had a PHL of 2 minutes and 10 seconds. Both silos were leaking air at the silo base entry door during the pressure tests indicating a location for potential gas loss and dilution of gas with fresh air from outside.

Figure 1. Phosphine concentrations measured in silo A (passive fumigation). The silo had a pressure half-life of 7 minutes and 30 seconds. The dosage (concentration x time) required to control phosphine-resistant lesser grain borer is indicted by the blue box and for phosphine-resistant rusty grain beetle by the red box.

Figure 1. Phosphine concentrations measured in silo A (passive fumigation). The silo had a pressure half-life of 7 minutes and 30 seconds. The dosage (concentration x time) required to control phosphine-resistant lesser grain borer is indicted by the blue box and for phosphine-resistant rusty grain beetle by the red box.

Figure 2. Phosphine concentrations measured in silo B (active fumigation). A recirculation system with an air-flow rate of 0.013 L/s/t was fitted to the silo and was run for the first five days of the fumigation. The silo had a below standard pressure half-life of 2 minutes 10 seconds. The dosage (concentration x time) required to control phosphine-resistant lesser grain borer is indicted by the blue box and for phosphine-resistant rusty grain beetle by the red boxes.  Two alternative strategies to meet the required dose to control phosphine-resistant rusty grain beetle are shown. That is, a higher concentration, shorter exposure period and a lower concentration, longer exposure period.

Figure 2. Phosphine concentrations measured in silo B (active fumigation). A recirculation system with an air-flow rate of 0.013 L/s/t was fitted to the silo and was run for the first five days of the fumigation. The silo had a below standard pressure half-life of 2 minutes 10 seconds. The dosage (concentration x time) required to control phosphine-resistant lesser grain borer is indicted by the blue box and for phosphine-resistant rusty grain beetle by the red boxes.  Two alternative strategies to meet the required dose to control phosphine-resistant rusty grain beetle are shown. That is, a higher concentration, shorter exposure period and a lower concentration, longer exposure period.

Conclusions

  • For phosphine fumigations, strongly phosphine resistant rusty grain beetle can only be controlled by extending fumigation time beyond the minimum label recommendation (of 20 d for blankets) or by implementing active recirculation in gas-tight, sealable silo (AS2628)
  • The current pressure half-life standard (AS2628) of 5 minutes is suitable for large silos
  • Fumigation without recirculation requires a fumigation period of over 30 days
  • Recirculation significantly shortened the fumigation period required to 14 days
  • The label recommendations for solid formulations of phosphine must be updated to allow effective control of strongly resistant rusty grain beetle
  • Should label rate fumigations with phosphine fail, and rusty grain beetle is identified, consider an alternative treatments such as sulfuryl fluoride (Profume®)

Based on these conclusions, options for updating the label to ensure control of phosphine resistant rusty grain beetle include:

  1. Increase application rate to maintain current fumigation period of 20 days for passive fumigations
  2. Keep current application rate but extend the passive fumigation period possibly past 30 days
  3. Keep the current application rate but mandate active recirculation, and maintain or possibly reduce the fumigation period
  4. Increase the application rate, mandate active recirculation and reduce the fumigation period

Increasing the application rate (option 1) may be possible but would require APVMA approval and may require significant industry input to undertake residue testing etc. Increasing fumigation period (option 2) is viable but fumigations may become too long to be practical. This option is heavily reliant on silos being sealed to the Australian standard of a 5 min pressure half-life. Mandating recirculation (option 3) would require a small capital cost to retrofit silos. Increasing the application rate in conjunction with active fumigation (option 4) could reduce fumigation times to a week or less.

A number of issues would need to be resolved if any changes are to be made to the label:

Increase application rate

  • Residue testing
  • WHS provisions

Increase fumigation time

  • Fumigating partially filled silos
  • Fumigating highly sorptive commodities such as canola

Active recirculation

  • Minimum flow rates
  • Fan run times

Measuring the level of silo gas-tightness

Pressure tests were carried out on silos A and B before the fumigation and at the end of the fumigation before venting to measure silo gas-tightness. Silos were sealed and pressurised using a cordless leaf blower. Internal pressure was measured using a digital manometer (Exotech HD755) connected to the plumbing of the pressure relief valve which comes from the headspace down the side of the silo.


Figure 3. Pressure loss from silo A demonstrates that pressure is lost at a fast rate at higher pressures compared to lower pressures. The rate of pressure loss slows down as the pressure gets closer to atmospheric. This is why it is important to conduct pressure half-life tests using the industry AS2628 standard test method, 250 to 125 Pa.
Figure 3
. Pressure loss from silo A demonstrates that pressure is lost at a fast rate at higher pressures compared to lower pressures. The rate of pressure loss slows down as the pressure gets closer to atmospheric. This is why it is important to conduct pressure half-life tests using the industry AS2628 standard test method, 250 to 125 Pa.

Recirculation system fitted to silo B

A tube was connected to the pressure relief downpipe to 0.37Kw power fan (F370 Downfield, Toowoomba) positioned between the two aeration ducting trenches of the silo (Figure 4). A two way splitter was fitted to the end of a PVC pipe and two 50 mm tubes of equal length was connected to the silo aeration ducting using standard plumbing fittings. Valves (50mm) made it possible to seal the silo at the aeration ducting and isolate the fan for removal. (The short length of white PCV pipe (ID 0.15 m) was fitted to the output side of the fan for the purpose of measuring air flows during the trial.)

Figure 4. Philip Burrill (DAF Qld) measuring air-flow in the recirculation system. For easy to follow details on how to measure air-flow in silos see https://storedgrain.com.au/testing-aeration/

Figure 4. Philip Burrill (DAF Qld) measuring air-flow in the recirculation system. For easy to follow details on how to measure air-flow in silos see this link to the Stored Grain website on Testing Aeration.

Acknowledgements

The research was part of the project PBCRC3150 “An integrated approach to manage and resistance to phosphine in stored grain” supported by the PBCRC of which the GRDC is a partner. Trial fumigations were conducted at Balarang Lands (Weemelah) owned and operated by Jason and Lisa Orchin. We thank them for their support. The authors wish to thank Peter Hobday from AgriStorage and Logistics for assistance conducting the trial.

Contact details

Andrew Ridley
Department of Agriculture and Fisheries, Queensland
EcoSciences Precinct, Boggo Road, Dutton Park
Mb: 0491 215 268
Ph: 07 3255 4442
Email: andrew.ridley@daf.qld.gov.au

Stored Grain App – Help

Register Menu
Register – You must enter your Name, email address as your username, password and select a GRDC region before tapping ‘Register’. On a successful ‘Register’ an email will be sent to the email address you entered, so you can confirm the account. If you do not receive a confirmation email after waiting a few minutes, check the email address you entered, check your spam/junk folder, if still no email contact info@storedgrain.com.au
The purpose for registering and logging in is to enable storage records to be synchronised with a secure GRDC server so you can access them via multiple devices and not lose your data when you replace your mobile device.

Confirm Registration via Email – Please click on the link in the email to make your account active.

Login – Enter your email and password, then tap ‘Login’ to connect the app into the server for data syncing. After a successful login, your username is displayed in the main menu.

Forgot Password – Enter your email address and tap ‘Retrieve’ to send a reset email to your nominated email address. From the email link, you will be taken to the web to enter a new password.
After you get a Reset Password Confirmation’ on the web, you can log into the app again.

Change Password – Enter your current password then your new password twice, tap ‘Change’ and a ‘Password Changed/Ok’ popup will appear. NOTE, if you change your password, you must log in again on this and any other device using the new password before doing a sync.

Change user – To change users, logout via the register tab and register or login as the second user. Please note, all storage records will be lost if you delete the app without being registered, logged in and completing a ‘sync data to server’ before deleting the app.

Ask an Expert Menu
Call 1800 WEEVIL – opens a phone call to your nearest grain storage expert.
Email Us – opens an email to the GRDC Grain Storage Project Manager to ask for specific grain storage information, ask for help with the app, provide feedback on the app or any other communication you wish to initiate.
Visit our website – opens a web browser to access www.storedgrain.com.au for the full suit of the Stored Grain Information Hub.
Share This App – enables you to share the app with friends and colleagues you think might be interested in it.
App Help – Takes you to the help page for explanatory notes on each function of the app.

Storage Records Menu
Add Storage Record – On the ‘Storage Records’ screen, tap on the ‘+Add’ button on top right of the main screen. Enter data and tap ‘Save’. Note, if you enter data into the ‘Date Emptied’ or the ‘Sold To’ fields, the record will appear red in the app to indicate the grain has been sold and is no longer in storage.

Sorting in Storage Records List – When you have multiple records for any one year, you can tap on the Headings to sort ascending or descending.

Edit Storage Record – To Edit a record detail or enter ‘Date Emptied’ or ‘Sold to’, tap ‘Edit’ bottom button left and then select the record you wish to edit. Note, the small red circle with a the dash in it, when tapped will enable you to delete the record. Once finished editing records, tap ‘Edit’ again to return to the normal viewing screen.

Copy Storage Record – A storage can be copied by tapping ‘Copy’ then selecting the storage you wish to copy. Handy if you want to keep records of a storage that has been emptied and refilled again in the same year. On Android, tap and hold a record to edit.

Open Storage Record – To view a record, just tap on the individual storage record. On the individual record screen you can move to previous and next records, as well as add in a monitoring record.

Add Monitoring Record– To add a monitoring record, open the storage record you wish to add monitoring details to and tap the ‘+Add’ next to the Monitoring Records heading. Enter the details you wish and tap ‘Save’. You will be returned automatically to the individual record screen.

Edit Monitoring Record – To edit a monitoring record, tap the ‘Edit’ button in an individual storage record to change the monitoring details or notes.

Delete Monitoring Record – To delete a monitoring record, tap the ‘Delete’ button in an individual storage record to delete that record.

Export Storage Records and Individual Storage/Monitoring Records – Tap ‘Export’ and an email will open with the data as an attached csv file.

Duplicate – To copy the records to the next tear, tap ‘Duplicate’ and the next year’s data will be created. Records which have sold grain will be duplicated and cleared. Note, until there are storage records in multiple years the ‘Last Year’ and ‘Next Year’ buttons will not do anything.

Sync Data to Server – If you are logged in and online, you can save your data to the secure GRDC server. The data is stored so you can access your records from multiple devices and not lose your data when you replace your mobile device. Tap ‘Sync Data to Server’ to send data to the server and also to retrieve previously stored data from the server.

Sync Data via multiple devices – You can be logged in as the one user on multiple devices. It is good practice to ‘Sync Data’ before and after entering any records to ensure data is not lost.

How to Guides Menu
Each subsection of the how to guide includes:
How to guides – a quick reference to the key information on that topic

Within the how to guide is blue text with links to:
View the storedgrain.com.au web site for more information
View the full pdf fact sheet on that topic, which can then be downloaded and saved or shared by tapping the export icon in the top right of the screen.

Video – explaining and demonstrating the key points of the topic. To start the video, tap the ‘Play’ icon, to close the video tap the ‘Pause’ icon then tap ‘<Menu’.

Submit Image – is an extra feature in the Pest ID section which enables you to email a photo from your device’s camera or photo gallery to your nearest grain storage expert to assist you in correctly identifying pests.

Super cool aeration results

Source Link GRDC
Author: Philip Burrill, DAF Qld.

Take home message

  • Seek advice to ensure the right size aeration fans and associated equipment are fitted – ducting, roof vents and fan controller.  Not all silo suppliers get it right.
  • Recommended aeration cooling airflow rates are 2 to 4 litres of air per second, per tonne (L/s/t).  Do your aeration fans achieve this when your silos are full of wheat, barley, chickpeas, sorghum, canola?
  • Are you achieving the target ‘grain temperatures’ of 18° to 23°C during summer storage and less than 15°C during the winter period?
  • Aeration maintenance: farm case studies show that aeration equipment checks and maintenance can lead to a significant improvement to aeration performance and grain storage results

Storage best practice – four key steps

Aeration cooling is just one of four key best practice strategies that provide good results for on farm storage.  When combined, they form the foundation for successful storage and importantly, a grower can build a reputation as a reliable supplier of quality grain.

  1. Aeration: correctly designed and managed, will provide cool grain temperatures and uniform grain moisture conditions. The result is reduced problems with grain moulds and insect pests in storage, plus the ability to maintain grain quality attributes such as germination, pulse seed colour, oil quality and flour quality.
  2. Hygiene: a good standard of storage facility hygiene is crucial in keeping storage pest numbers to a minimum and reducing the risk of grain contamination.
  3. Monitoring: monthly checking of grain in storage for insect pests (sieving / trapping) and at the same time inspect grain quality and temperature. Keep a monthly storage record to record these details, including any grain treatments you applied.
  4. Fumigation: in Australia we now only have gases (fumigation) to deal with insect pest infestations in stored grain. To achieve effective fumigations the storage/silo must be sealable – gas-tight (AS2628) to hold the gas concentration for the required time.

Effective aeration – what does it look like?

For the summer storage period November to April we aim to achieve grain temperatures of 18° to 23°C with well managed aeration cooling. For the winter period May to September the target is grain temperatures of less than 15°C.

Push a robust thermometer attached securely to a broom handle, or better, a purpose built grain temperature probe one meter into grain. Leave for a few minutes in grain before reading to see what grain temperature your aeration system has achieved.

Figure 1. Two silos -wheat. Non-aerated silo had grain temperature sit above 30°C for 3 months, ideal for insect breeding. Well managed aeration in summer brings temperatures down towards 20°C.

Figure 1. Two silos -wheat.  Non-aerated silo had grain temperature sit above 30°C for 3 months, ideal for insect breeding. Well managed aeration in summer brings temperatures down towards 20°C.

Aeration – achieving good results

There are three areas to focus on for good aeration results:

  1. Aeration equipment for the job
  2. Operating aeration system effectively
  3. Maintaining / checking the equipment is doing the job

a.      Aeration equipment for the job

The three main components are fans, ducting inside the storage and the roof vents.

Fan selection: Fan size, number per silo and type of fan are common areas for confusion. It usually requires an “experienced grain aeration specialist” to provide advice to either the silo manufacturer / supplier, or directly to the grower.  There are a number of important considerations to consider before fitting fans to a silo or storage.

Silo size – height & width, electricity supply available at site, grain types stored, typical harvest grain moisture contents, and what is the intended purpose of fans?  Is it only for aeration cooling (2 – 4 L/s/t) , or do you want to set up one or two silos with much larger airflows (15 – 25 L/s/t) for the purpose of aeration drying?

These details can be quickly sorted out with one or two phone calls, when you are dealing with an experienced aeration specialist. It is vital that the right questions are asked.  The result, the fan selection, ducting and venting design suits the intended purpose for your grain storage situation.

Figure 2. Note the large variation in aeration fan ouputs for four typical fans fitted to grain storages

Figure 2.   Note the large variation in aeration fan ouputs for four typical fans fitted to grain storages

Farm case study 1: A 130 tonne capacity cone based silo, nearly full with 105 tonnes of barley, fitted with one 0.37 kW aeration fan was tested for airflow output.  Using the ‘A-Flow’ testing device (GRDC fact sheet, “Performance testing aeration systems”) the single aeration fan was only able to generate 166 litres of air per second, or 1.6 L/s/t airflow against the 105 tonnes barley.  Result: grower decided to fit a second fan (same size) on the opposite side, aiming for 3.0 L/s/t

Farm case study 2: Two Grainmaster™ 150 tonne capacity cone based silos, both fitted with a pair of 0.37 kW Agrdry F100 aeration fans. One silo was full with 140 tonnes of Soybeans and the other silo full with 150 tonnes of White French millet. With identical fans running on identical silos the total airflow output through the soybeans was 397 L/s, providing a useful 2.8 L/s/t.  However airflow going into the White French millet silo was only a total of 141 L/s, providing a much lower 0.9 L/s/t.  The extra back pressure on fans created by the small seed millet was reducing aeration airflow to well below the recommended cooling range of 2 – 4 L/s/t.

Ducting inside silo: There are two common types, the round tube ducting that can be made to lift up for cleaning, or the house shaped ducting that is fixed down to the cone base.  Ducting length, strength, location in silo and size of perforation holes / slots, all involved in achieving optimum airflows through grain. Ability to clean and remove grain residues from ducting for silo hygiene is important for both cone base or flat bottom silos.

Roof vents: Vents can be as simple as a “Chinaman hat style” used on the centre fill top hatch, or the many variations of “goose neck” roof vents.  Unfortunately it is not uncommon to see venting design problems on range of silo brands.

The vent size / area needs to be appropriate to suit the fan output. A fan’s airflow should not be used at start up to lift heavy vent lids, or constantly work against lid springs. This ensures fan airflow is not restricted. For all sealable silos, vents require simple, effective systems for creating a gas tight seal during fumigation. Do you also have easy access to vents for maintenance on rubber seal?

Farm case study 3: Three new 150 tonne capacity, sealable, aerated silos, each fitted with two 0.37 kW Downfield F370 aeration fans (smallest curve on Fig. 2 is the F370 fan).  The storage facility manager was concerned about fan output after he tested fans shortly after the silos construction was completed. He was comparing the operating sound of fans running using the four vents fitted to the roof, with the fan’s sound when he also manually opened the centre top fill hatch as well. The fan performance sounded like it improved with the extra vent space provided.

When fan output was tested (A-Flow device) on the ‘empty’ (no grain back pressure) new silo, the pair of F370 fans could only achieve a total of 209 L/s airflow with the four vents used as designed. When the centre top fill lid was also opened, output immediately increased to 517 L/s.

On closer inspection the 4 sealable vents on the roof had no system to hold them open during aeration. There was only a long flexible cable to pull them closed / sealed for silo fumigations.  Fans were losing more than half their unloaded performance, just by forcing them to lift four steel plate vent lids. Result: when the silo manufacturer was made aware of the design problem they arranged to fit a simple vent lid lifter.

Access to four vents around the roof edge to maintain rubber seals, is the next design challenge.

b.      Operating aeration system effectively

Running the fan at the right times will achieve cool grain temperatures and uniform moistures.  Aeration cooling aims to push through a series of ‘cooling fronts’ starting from the base of the silo.

Figure 3. Cooling / drying fronts in the aeration process (C. Newman Agric. WA)

Figure 3. Cooling / drying fronts in the aeration process (C. Newman Agric. WA)

While there are a number of producers still manually operating aeration fans, for most storage facilities we recommend using a good quality automatic aeration controller with a sensor measuring both ambient air temperature and humidity to automatically turn on fans at optimum times.

Manual operation of fans

There are three stages when operating aeration cooling fans from the start of harvest:

  1. As soon as enough grain covers the ducting, turn on aeration fans while filling silo. Run continuously (24hrs / day) until the first cooling front comes through the full grain depth. This usually takes 3 – 5 days.  If safe, go to the top of the silo and see if the air coming out has changed from a warm, humid smell to a fresh, cool smell. The first cooling front is through. See Figure 3.
  2. Once this has occurred, run the fans for approximately 12 hours per day for the next 5 – 7 days. Select the cooler night air, but avoid extended periods of high humidity air which may wet grain.  Avoid fog, misty or showery conditions.
  3. Check the grain temperature and condition.  Grain temperature in summer should now be close to 20°C.  The longer term “protect” phase now begins. Operate fan for approx. 100 hours per month, selecting cool, mostly dry air from 3 – 5 days per week to maintain cool grain conditions.  An automatic controller will usually be much more reliable at this task.

Automatic controller operation of fans

Today there are automatic aeration controllers available that automatically step through the three stages outlined above.

Seek independent advice as to what are the better quality controllers to consider, as there are poor quality units that may put your stored grain at risk. Ensure the supplier has a good reputation for providing after sales support and parts if required.

For a new unit fitted to a storage facility, there is simple start up process to follow. See manual, or consult supplier. As a general rule, leave the auto controller itself powered up. It is recording a history of current weather conditions so it is able to turn fans on at the optimum times.

c.       Maintaining and checking aeration equipment

There are a few basic checks and maintenance steps to ensure your system is doing the job.

  • Check grain temperatures to see if you are achieving the target temperatures of 18° to 23°C during summer storage and less than 15°C during the winter period.
  • See Figure. 4 where an OPI® cable was used in the aerated barley silo (“Farm case study 1”) to record grain temperatures at various depths. This helped identify the low airflow problem.
  • When checking silos each month for insects, also look at the hour meter on the aeration auto controller to see if fans are averaging approx. 100 hours per month (+/- 20 hrs).
  • At least once per year use a good quality thermometer and relative humidity reader to check the aeration auto controller’s sensor has not been damaged and is readings correctly.
  • Manually test-run fans on silos to check they are all operating.  Clean fans if required.

Farm case study 4: A ten minute fan cleaning job can produce large improvements. A single 0.37 kW aeration fan was tested for airflow output on a 128 tonne capacity coned based silo holding 105 tonnes of barley. It was observed that the fan impeller had a significant build-up of dust on the blades prior to testing. Using the ‘A-Flow’ testing device, the aeration fan output was recorded as 86 L/s, or 0.8 L/s/t airflow against the 105 tonnes barley.  After cleaning the dust from the blades the fan was retested and produced an output of 152 L/s, or 1.5 L/s/t.  Result: grower cleaned remaining fans.

Figure 4. Temperatures in a silo of barley in headspace and at three grain depths. The warmer than expected grain temperatures indicated possible aeration problem. See Farm Case study 1.

Figure 4. Temperatures in a silo of barley in headspace and at three grain depths. The warmer than expected grain temperatures indicated possible aeration problem. See Farm Case study 1.

Further reading

Acknowledgements

The research undertaken is made possible by the significant contributions of growers through both trial cooperation and support of GRDC, DAF Postharvest research team and GRDC’s national grain storage extension team, the author would like to thank them for their continued support.

Contact details

Philip Burrill
Department of Agriculture & Fisheries, AgriScience Qld.
Hermitage research facility, 604 Yangan road, Warwick Qld. 4370
Mb: 0427 696 500
Email: philip.burrill@daf.qld.gov.au

Grain bags – Fumigation

Stored Grain bag fumigation

Two methods for fumigating and venting grain bags with phosphine have been trialed. While passively venting a grain bag is possible, it takes significantly longer than using a fan to draw the gas out. 

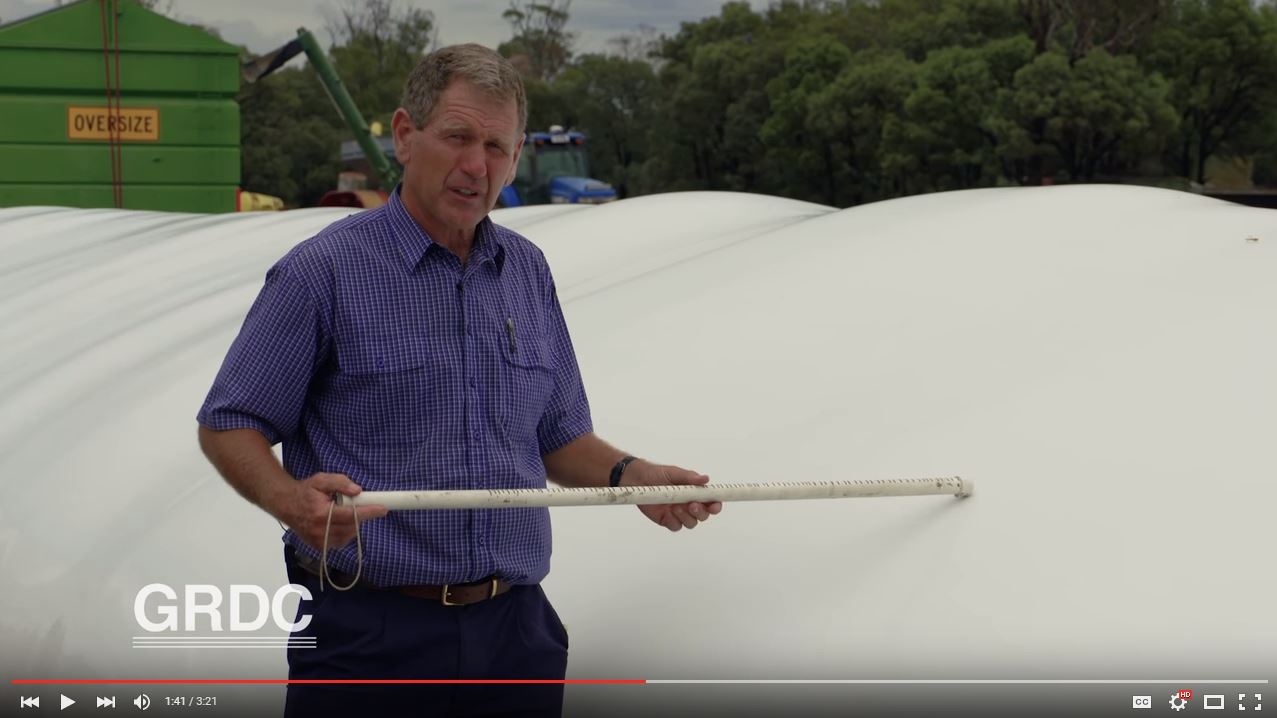
Below is a video of Philip Burrill demonstrating the quicker method of venting using a fan. In the video below that, Chris Warrick demonstrates a passive method and outlines what to expect. 

Always follow label directions and use the specified Personal Protective Equipment. 

Venting with a fan

Venting passively without a fan